This test is the first test that should be performed on a PC to see if it is able to drive a CNC machine.
Latency is how long it takes the PC to stop what it is doing and respond to an external request. For LinuxCNC the request is BASE_THREAD that makes the periodic heartbeat that serves as a timing reference for the step pulses. The lower the latency, the faster you can run the heartbeat, and the faster and smoother the step pulses will be.
Latency is far more important than CPU speed. A lowly Pentium II that responds to interrupts within 10 microseconds each and every time can give better results than the latest and fastest P4 Hyperthreading beast.
The CPU isn’t the only factor in determining latency. Motherboards, video cards, USB ports, and a number of other things can hurt the latency. The best way to find out what you are dealing with is to run the RTAI latency test.
Generating step pulses in software has one very big advantage - it’s free. Just about every PC has a parallel port that is capable of outputting step pulses that are generated by the software. However, software step pulses also have some disadvantages:
-
limited maximum step rate
-
jitter in the generated pulses
-
loads the CPU
The best way to find out how well your PC will lrun LinuxCNC is to run the HAL latency test. To run the test, open a terminal window (In Ubuntu, from Applications → Accessories → Terminal) and run the following command:
latency-testYou should see something like this:
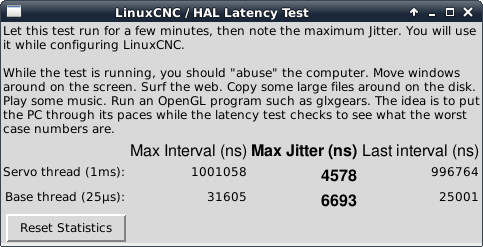
While the test is running, you should abuse the computer. Move windows around on the screen. Surf the web. Copy some large files around on the disk. Play some music. Run an OpenGL program such as glxgears. The idea is to put the PC through its paces while the latency test checks to see what the worst case numbers are.
|
Note
|
Do not run LinuxCNC or Stepconf while the latency test is running. |
The important number for software stepping is the max jitter of the base thread. In the example above, that is 6693 nanoseconds, or 6.693 microseconds. Record this number, and enter it in Stepconf when it is requested.
In the example above, latency-test only ran for a few seconds. You should run the test for at least several minutes; sometimes the worst case latency doesn’t happen very often, or only happens when you do some particular action. For instance, one Intel motherboard worked pretty well most of the time, but every 64 seconds it had a very bad 300 us latency. Fortunately that was fixable, see http://wiki.linuxcnc.org/cgi-bin/wiki.pl?FixingSMIIssues
So, what do the results mean? If your Max Jitter number is less than about 15-20 microseconds (15000-20000 nanoseconds), the computer should give very nice results with software stepping. If the max latency is more like 30-50 microseconds, you can still get good results, but your maximum step rate might be a little disappointing, especially if you use microstepping or have very fine pitch leadscrews. If the numbers are 100 us or more (100,000 nanoseconds), then the PC is not a good candidate for software stepping. Numbers over 1 millisecond (1,000,000 nanoseconds) mean the PC is not a good candidate for LinuxCNC, regardless of whether you use software stepping or not.
Note that if you get high numbers, there may be ways to improve them. Another PC had very bad latency (several milliseconds) when using the onboard video. But a $5 used video card solved the problem.
|
Note
|
LinuxCNC does not require bleeding edge hardware. |
For more information on stepper tuning see the Stepper Tuning Chapter.
Additional command line tools are availalbe for examining latency when LinuxCNC is not running.
latency-plot makes a strip chart recording for a base and a servo thread. It may be useful to see spikes in latency when other applications are started or used. Usage:
latency-plot --help

Usage:
      latency-plot --help | -?      (this)
      latency-plot --hal [Options]

Options:
      --base nS  (base  thread interval, default:   25000)
      --servo nS (servo thread interval, default: 1000000)
      --time mS  (report interval, default: 1000)
      --relative (relative clock time (default))
      --actual   (actual clock time)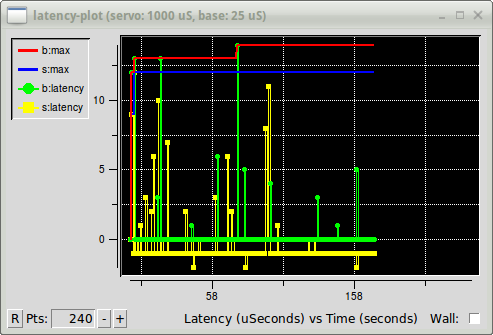
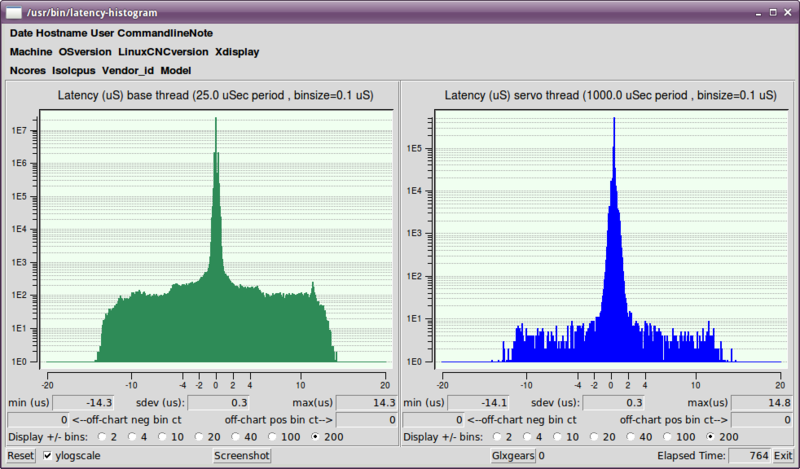
latency-histogram displays a histogram of latency (jitter) for a base and servo thread.
Usage:
   latency-histogram --help | -?
or
   latency-histogram [Options]

Options:
  --base      nS   (base  thread interval, default:   25000, min:  5000)
  --servo     nS   (servo thread interval, default: 1000000, min: 25000)
  --bbinsize  nS   (base  bin size,  default: 100
  --sbinsize  nS   (servo bin size, default: 100
  --bbins     n    (base  bins, default: 200
  --sbins     n    (servo bins, default: 200
  --logscale  0|1  (y axis log scale, default: 1)
  --text      note (additional note, default: "" )
  --show           (show count of undisplayed bins)
  --nobase         (servo thread only)
  --verbose        (progress and debug)
  --nox            (no gui, display elapsed,min,max,sdev for each thread)

Notes:
  Linuxcnc and Hal should not be running, stop with halrun -U.
  Large number of bins and/or small binsizes will slow updates.
  For single thread, specify --nobase (and options for servo thread).
  Measured latencies outside of the +/- bin range are reported
  with special end bars.  Use --show to show count for
  the off-chart [pos|neg] bin